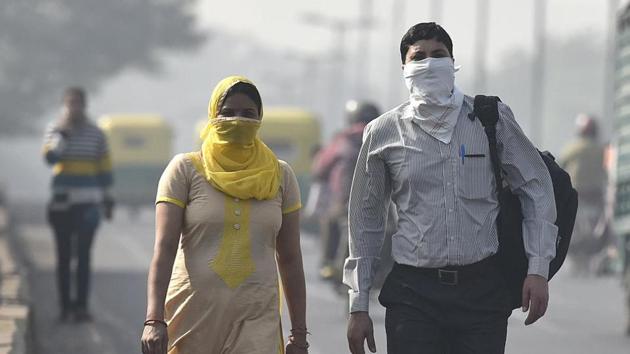
Vehicles, industries biggest contributors to pollution in Delhi-NCR: SAFAR study
SAFAR had conducted an emissions inventory for Delhi-NCR in 2010, too, and a comparison with that shows emissions from transport and industrial sectors have gone up by 40% and 48%.
An emissions inventory by the Pune-based System of Air Quality and Weather Forecasting Research (SAFAR) under the ministry of earth sciences (MoES) has found that vehicles and industries are the biggest contributors to particulate matter (PM) 2.5 emissions in Delhi-NCR.

SAFAR had conducted an emissions inventory for Delhi-NCR in 2010, too, and a comparison with that shows emissions from the residential sector have fallen by 64% due to LPG access even in slums. Emissions from transport and industrial sectors have gone up by 40% and 48%, respectively. Surprisingly, windblown dust, which is often blamed for pollution in Delhi, also reduced by 26% between 2010 and 2018.
The study says lower vehicle speed due to an increase in traffic congestion could be a reason for reduction in windblown dust which gets exacerbated when vehicles speed on roads.
The 64% reduction in emissions from biomass burning in the residential sector can be linked to “penetration of LPG in slum areas, street vendors, household and others,” it said.
The inventory states that heavy commercial vehicles and private four-wheelers have emerged as the main pollution sources in Delhi.
Local para-transit, particularly cabs, have significantly high vehicle kilometre travelled (VKT) of about 1.45 lakh km per year per car in Delhi, the study said. Everyday vehicle load at the eight entry points of Delhi, mainly from other states, is about 11 lakh, while the average speed of vehicles in Delhi on major roads is only 20 to 30 kmph leading to poor vehicle mileage and resultant emissions from idling vehicles.
While industrial emissions contributed to only 18.6% of PM 2.5 emissions in Delhi, the inventory for NCR shows the contribution from industry is about 22.3%. “Industrial emissions increased by 48% in 2018 compared to 2010, mainly due to increase in industrial activities in fringe areas of Delhi and not inside Delhi. Most industries were shifted out of Delhi in the 90s,” Gufran Beig, lead author of the study and project director of SAFAR, said.
Stay updated with all top Cities including, Bengaluru, Delhi, Mumbai and more across India. Stay informed on the latest happenings in World News along with Delhi Election 2025 and Delhi Election Result 2025 Live, New Delhi Election Result Live, Kalkaji Election Result Live at Hindustan Times.
Stay updated with all top Cities including, Bengaluru, Delhi, Mumbai and more across India. Stay informed on the latest happenings in World News along with Delhi Election 2025 and Delhi Election Result 2025 Live, New Delhi Election Result Live, Kalkaji Election Result Live at Hindustan Times.


