
How the world’s strictest lockdown affected India
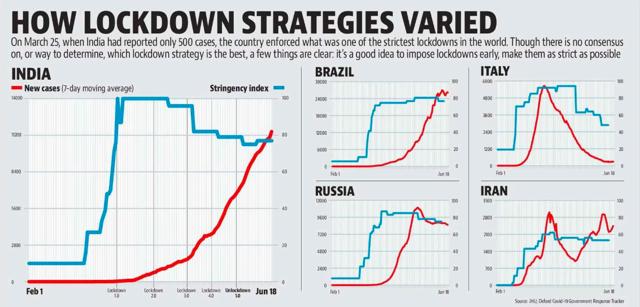
The preferred first step to control Covid-19 by most countries was a lockdown. On March 25, when India had reported only 500 cases, the country went into what was one of the strictest lockdowns in the world.
The preferred first step to control Covid-19 by most countries was a lockdown. On March 25, when India had reported only 500 cases, the country went into what was one of the strictest lockdowns in the world. This first set of curbs remained in place till April 14 and was extended four times, each time with gradual relaxations. The rest of the world adopted different models.
(AFP photo)")
STRATEGIES
An analysis of countries with the highest Covid-19 cases shows most of them have not relaxed lockdowns without a decline in daily cases. In fact, some continue with the strictest measures even after several days of fall in cases or have only reduced the stringency marginally. Those who haven’t followed these two paths seem to find it difficult to continue reducing daily cases. To be sure, this could also mean that a lockdown, although necessary, isn’t a sufficient enough measure to contain the infection.
On June 18, 15 countries with the most Covid-19 cases in descending order were: United States, Brazil, Russia, India, United Kingdom, Spain, Peru, Italy, Chile, Iran, Germany, Turkey, Pakistan, Mexico, and France. Most of these 15 countries can be categorised into two groups based on the daily number of cases (we consider a seven-day rolling average to smooth out daily fluctuations): those with a rising number of cases, and those that have seen a decline in daily cases.
The former group comprises India, Pakistan, and three of Latin American countries: Brazil, Chile, and Mexico. Of these five countries, India and Pakistan imposed the harshest lockdowns. The stringency index – a number given by the Oxford Covid-19 Government Response Tracker to the harshness of the lockdown imposed – of India’s March 25 lockdown was 100. The highest number recorded for Pakistan was 96. These two countries also relaxed the lockdown the most without the infection slowing its spread. The number hovered around the 80 mark for Brazil, Mexico, and Chile. The former two relaxed the lockdown marginally recently, while Chile made it slightly more stringent.
Countries that have seen a significant decline from the peak of their daily cases – viz. rest of the countries excluding Iran – have also reduced the stringency of their lockdowns only after a consistent decline, or have made no or minor relaxations. The latter group includes the United States, which officially made no relaxations; and Turkey and United Kingdom, which gave a marginal relaxation. In the US, however, the strictness number is 72.7.
France, Spain, Italy, and Germany have given more relaxations, but only after the peak. Russia, which relaxed its lockdown marginally in the middle of the peak, has seen its number of daily cases stagnate. Saudi Arabia, 16th on the list of countries with the highest cases on June 18, relaxed its lockdown very fast after the cases peaked, and has seen a second wave. So has Iran, which imposed a less strict lockdown to begin with, and has since made only a small reduction in the stringency.
Though there is no consensus on, or way to determine, which strategy is the best, a few things are clear: it’s a good idea to impose lockdowns early, make them as strict as possible, and from a spread of disease standpoint, lift them only after the peak. To be sure, factors such the cost of the lockdown – higher for developing than developed countries – may not always allow this. India is a case in point because it imposed the earliest and strictest lockdown, but eased restrictions before cases peaked.
NATURAL RELIEF
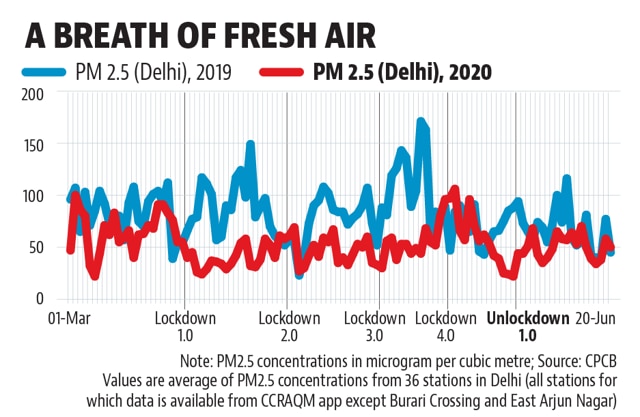
One good thing the restrictions brought was a breath of fresh air, literally. As people stayed at home, factories, cars, buses fell silent, giving the planet a much-needed (albeit temporary) relief. The air quality in Delhi – notorious for air pollution – improved. The average of PM2.5 concentrations was far better in 2020 compared to 2019 in the period of the lockdown. PM2.5 refers to particles with diameter less than 2.5 micrometers in the air.
As the lockdown began to be eased from the second half of May, PM2.5 concentration in Delhi nearly went back to 2019 levels. To be sure, even in the lockdown period, air pollution in the city wasn’t always better than that in 2019. For example, in the April 13 to April 17 period, the concentrations were near the “good” and “satisfactory” range both in 2019 and 2020. This could have occurred last year because there were rains in this period, which might have cleared the air of pollutants.
EMPLOYMENT
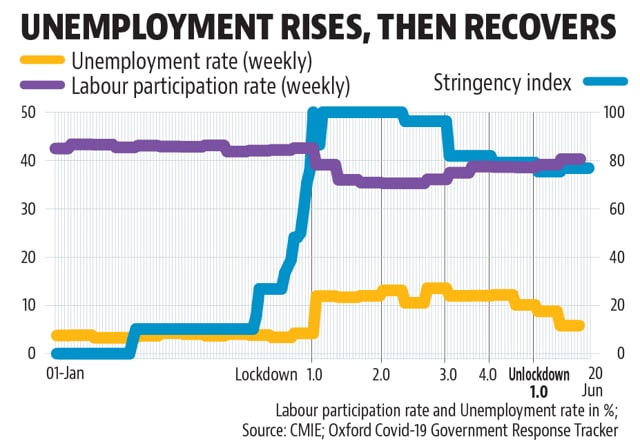
Data from the Consumer Pyramids Household Survey (CPHS) of the Centre for Monitoring Indian Economy (CMIE) shows the unemployment rate in India rose to 23.8% in the week ended March 29 – the week when the lockdown was introduced – from 8.4% in the preceding week. This was the highest unemployment rate since the survey started in 2016.
This was accompanied by a drop in the labour force participation rate (LFPR) – the share of people looking for work – to 39.2%, the lowest since the survey began. Although these numbers are not to be taken at face value – CMIE reported problems in data collection in the lockdown –they do indicate the direction of two things. One, people stopped looking for work due to the lockdown. Two, a higher than usual share of people looking for work didn’t find any.
As the lockdown progressed, LFPR continued to drop and reached its lowest level in the week ending April 19, when the lockdown was slightly reduced. LFPR recovered to 38.7% in the last two weeks of May – the last phase of the lockdown. The unemployment rate has, however, not followed the trajectory of the stringency of the lockdown as much as LFPR. Although it did reach a high of 27% in the week ending May 3, when the second phase of the lockdown ended, it mostly hovered around the 24% mark for most of the lockdown period, dropping to 20.2% only in the last phase of the lockdown.
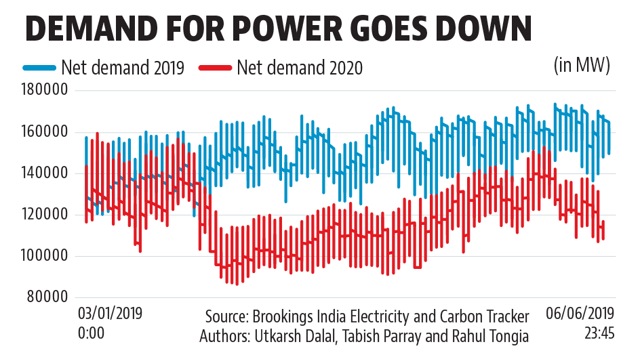
POWER DEMAND
As most activity dropped across the country in the weeks following March 25, the demand for power fell as well, according to data gathered by the Brookings India Electricity and Carbon Tracker. An analysis of this data shows that in the first week of March 2020, the demand for power saw an average drop of 1.2% compared to the same period in 2019. In the week between March 25 and March 31, at an average the year-on-year demand for power fell 31.4%, the data shows.
In the final week of May, which corresponds with the end of the fourth phase of the lockdown, the average demand for power saw a marginal rise, though it still remained 17.3% below the average demand in the same time period last year.
LIFE IN LOCKDOWN
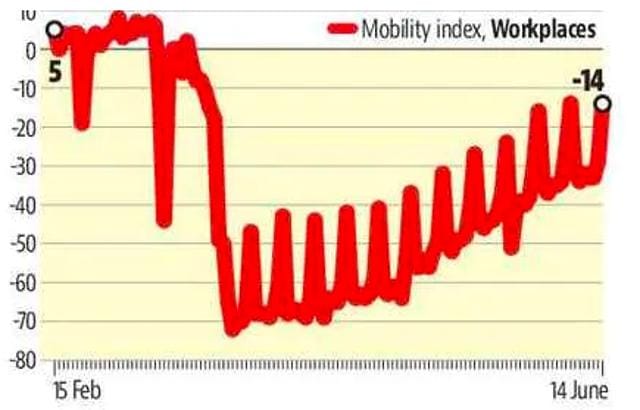
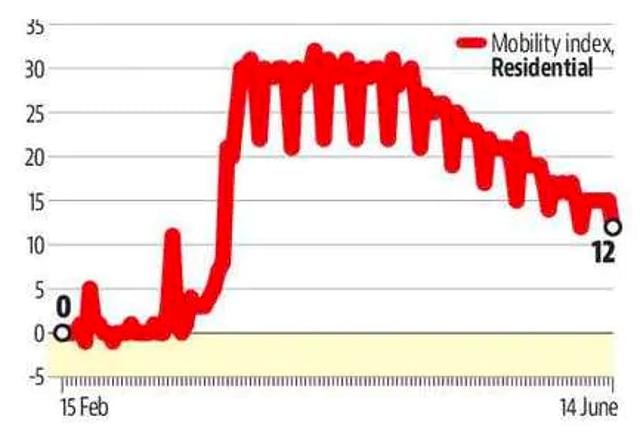
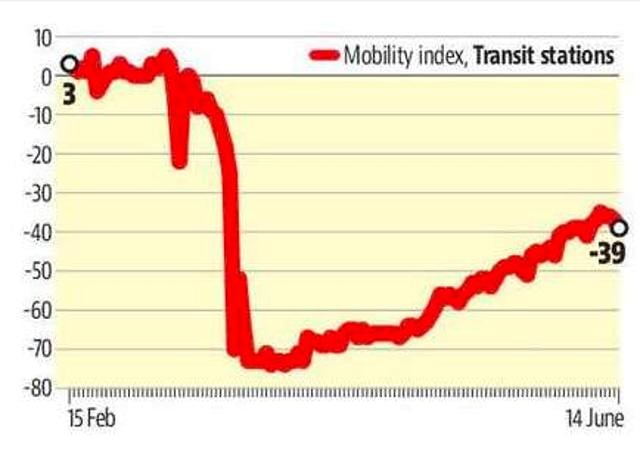
Mobility of people
Google publishes Covid-19 Community Mobility Reports for 131 countries to show how the lockdown affected the movement of people. The report uses “aggregated and anonymised data to chart movement trends over time by geography” across a range of places such as grocery stores, parks, workplaces and places of transit.
Workplaces
Movement at offices and workplaces dropped to its lowest in the recorded time frame touching -72% on March 25 — the day the nationwide lockdown kicked off. It averaged in the late minus 60s till the end of the second phase of the lockdown, from when it started showing a gradual recovery.
Residential
There was a 30% increase from baseline in mobility around residential areas on the first day of the lockdown. This remained more or less the same through the next five weeks, with the only fluctuations recorded on Sundays. Through May, however, movement around residential areas started dropping every week.
Transit hubs
When the lockdown kicked off, movement at transit hubs such as trains and metro stations dropped 73% from the baseline. In the four weeks since, it recovered slightly and continued to remain around 60% below baseline.
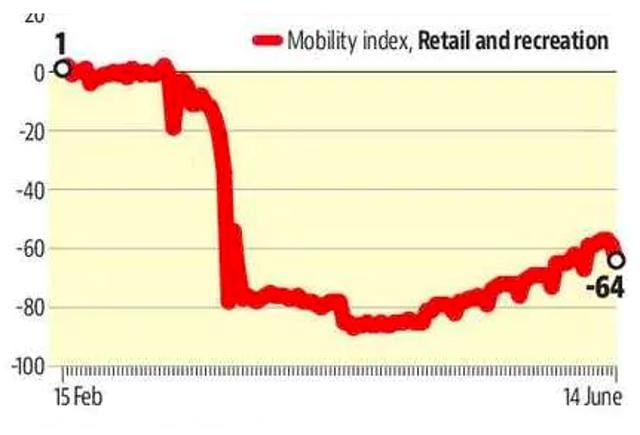
Retail and recreation
There was 77% drop in movement at retail and recreational locations across the country on March 25, the first day of the lockdown. This remained low the next few weeks, hovering around 80% through April and most of May, dropping as low as -87% on April 18. Through May, however, activity started recovering slightly by the end of the fourth lockdown. In the week ending June 14, activity continued to remain low, averaging -59%.
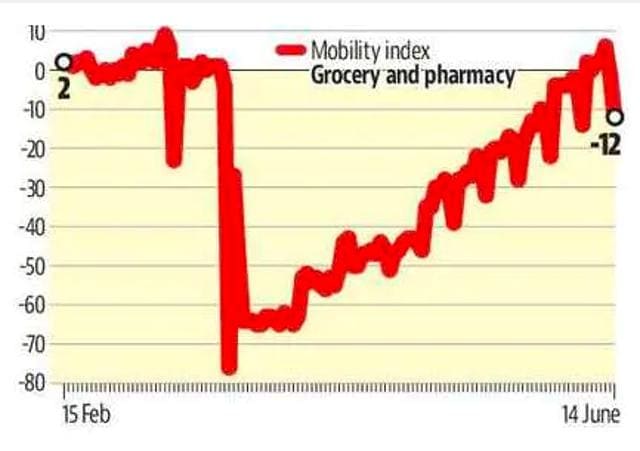
Grocery and pharmacy
There was 77% drop in movement at retail and recreational locations across the country on March 25. This remained low the next few weeks, hovering around 80% through April and most of May, dropping as low as -87% on April 18. Through May, however, activity started recovering slightly by the end of the fourth lockdown. In the week ending June 14, activity continued to remain low, averaging -59%.
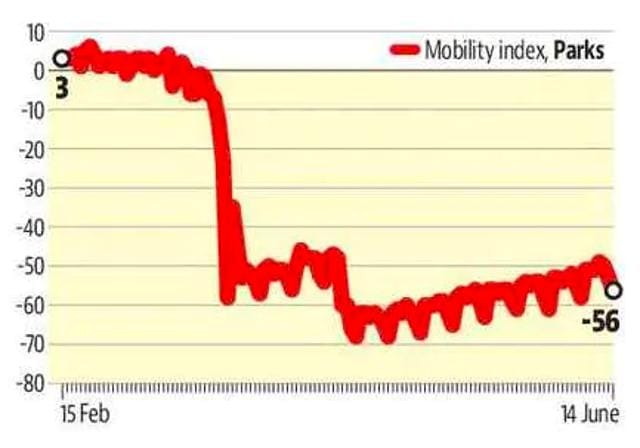
Parks
This was one of the fields studied in the report that has shown the least recovery. On May 25, data shows that 54% fewer people were logged in and around parks across the country. This went on to drop to as much as -68% by the end of March. And though it since recovered slightly, movement at parks remained -56% on June 14 – the latest day for which data is available.