


Gujarat election results: Make no mistake, the contest in Modi’s home state was really close
The Gujarat election results show ‘none of the above (NOTA)’ has polled more votes than the victory margin in 30 assembly constituencies.
The BJP has a comfortable lead in terms of both vote share and seat share in the results which have been declared today. This does not mean that Gujarat 2017 was not a closely contested election. Here are four charts which prove this.
")
None of the above (NOTA) has polled more votes than the victory margin in 30 assembly constituencies. Party-wise distribution of these seats is 15, 13 and 2 in favour of BJP, Congress and Independents, respectively. The NOTA option was only introduced in 2013. Had it not been there, the overall seat tally could have been very different. (See Map 1)
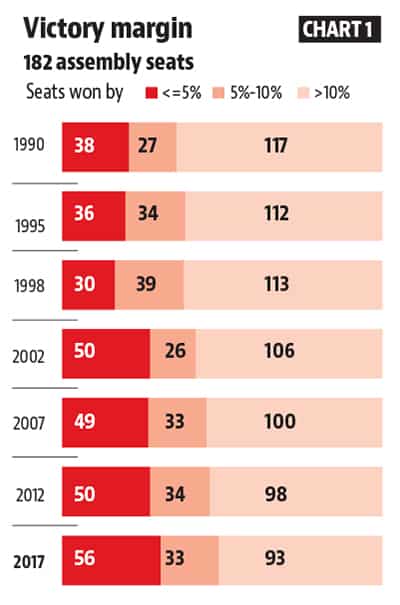
The number of constituencies where the victory margin is under 10% of total votes polled is the highest since 1990. Almost half of Gujarat’s seats have been decided with a margin of under 10% votes. This is also true for number of seats where the victory margin is under 5% of total votes polled. This is 30% of the total seats in the assembly. (See Chart 1)
Narrow victory margins are also reflected in the overall median victory margin in the 2017 Gujarat assembly elections. This is the lowest since 1990. (See Chart 2)
The close contest is only a rural story though. The median victory margin in urban areas is almost thrice that in rural ones. The BJP’s huge lead over the Congress in urban areas explains this gap. Both the BJP and Congress have improved upon their median victory margins in the urban areas in comparison to 2012. BJP’s median victory margin in urban areas exceeds that of the Congress by more than 22 percentage points. This is despite the Congress marginally improving upon its 2012 median victory margin in urban areas. In the rural areas, the BJP suffered a 3 percentage point decline in its median victory margin compared to 2012. Both the BJP and Congress are neck to neck in terms of median victory margins in rural areas. (See Chart 3)