


Number Theory: How global mayhem affected Indian markets
Apr 08, 2025 07:32 AM IST
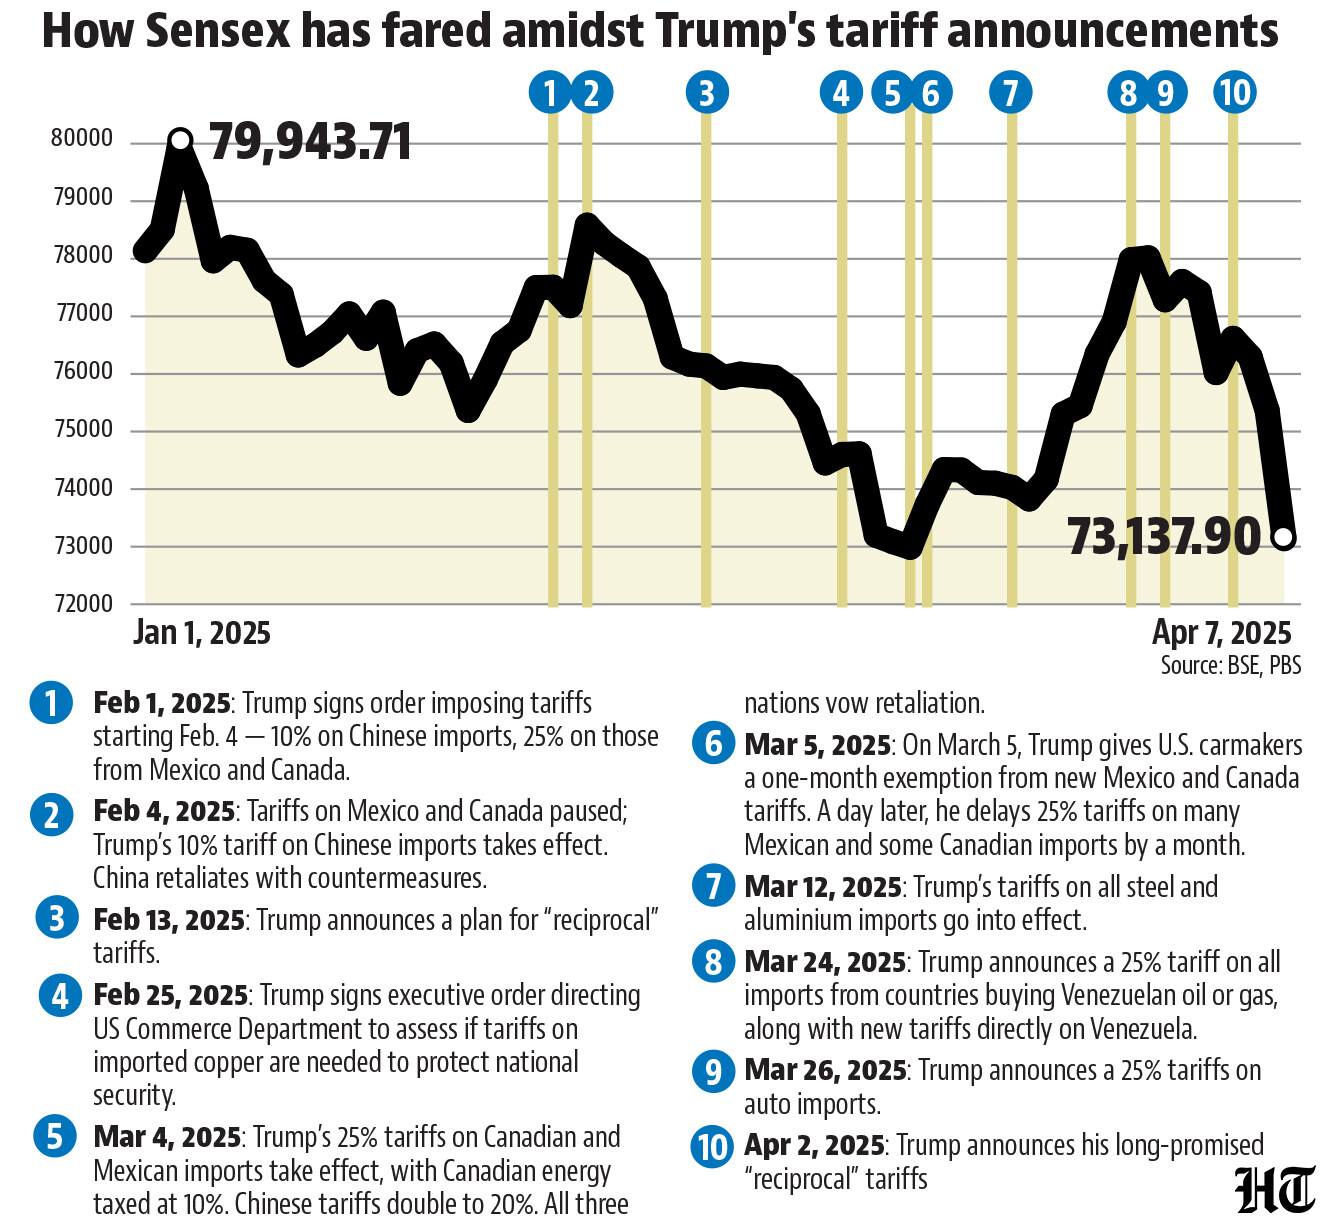
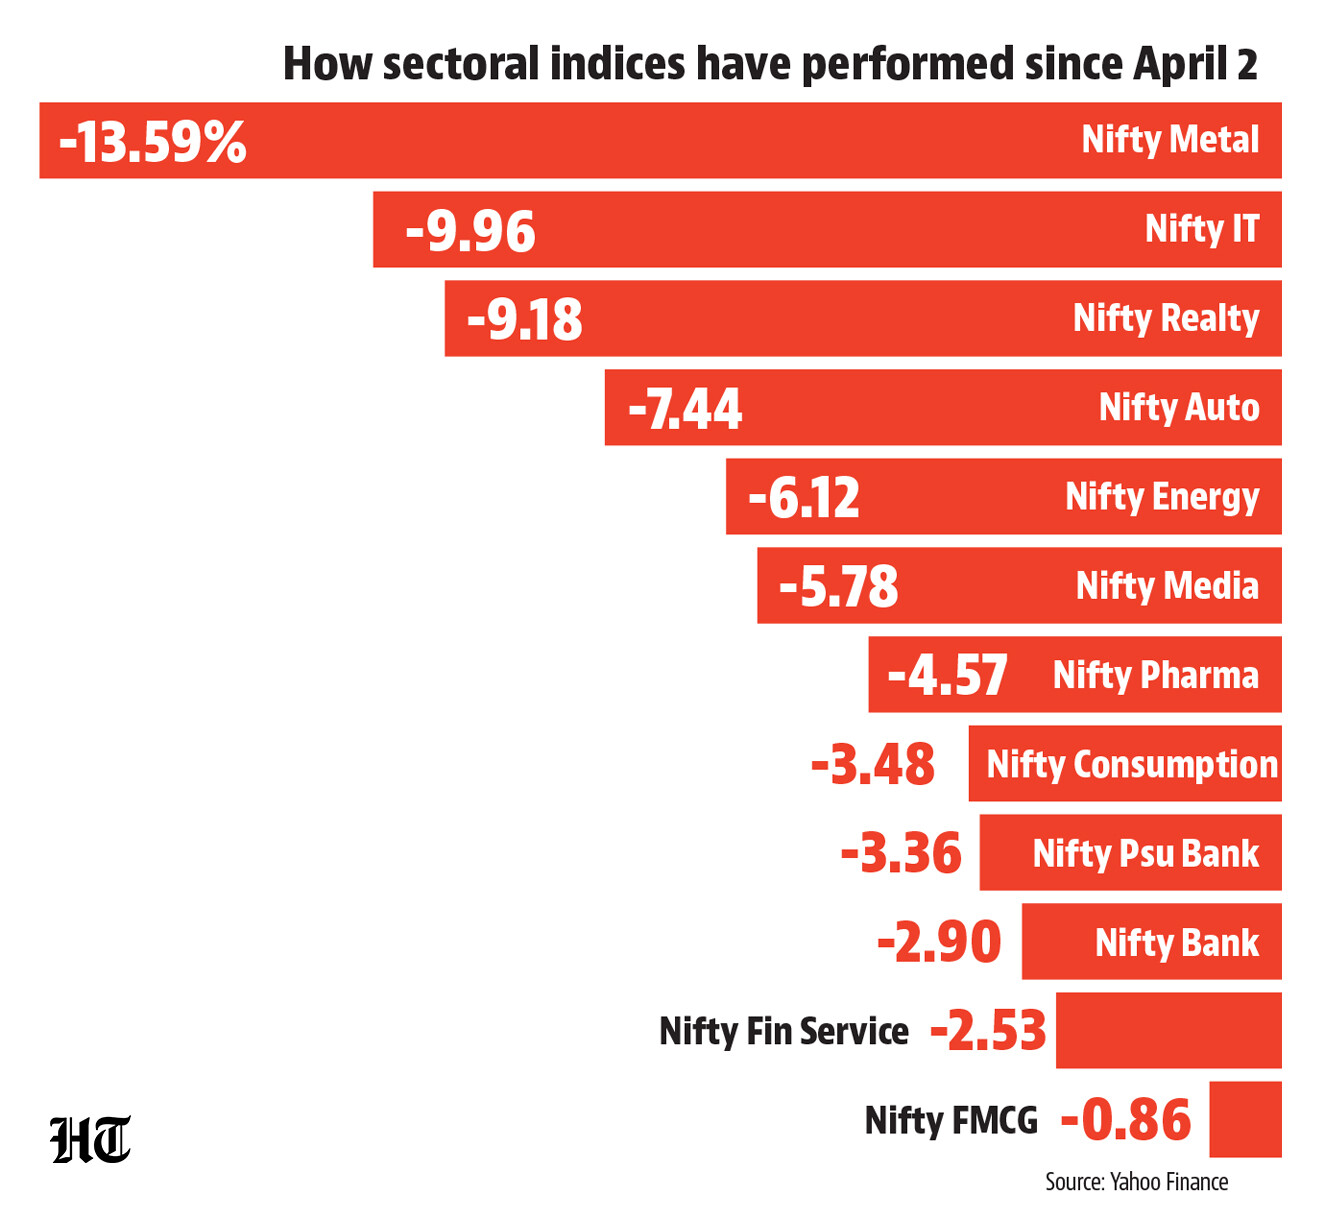
The following charts examine how the crash unfolded and what history tells us about periods of extreme market turbulence
Asian and European stock markets tumbled on Monday amid mounting investor fears of a global recession, driven by intensifying trade tensions sparked by Donald Trump’s tariffs. With major economies showing no signs of backing down, further market volatility is expected. The following charts examine how the crash unfolded and what history tells us about periods of extreme market turbulence.


Unlock a world of Benefits with HT! From insightful newsletters to real-time news alerts and a personalized news feed – it's all here, just a click away! -Login Now!
Unlock a world of Benefits with HT! From insightful newsletters to real-time news alerts and a personalized news feed – it's all here, just a click away! -Login Now!
